

Compared to a day ago, Bitcoin is 3% lower now, and it’s down 8% from a week ago. Market watchers, however, note that such a decline in Bitcoin’s value in January is typical. Therefore, a crucial technical indication suggests that the bull market might start up again, with a possible peak in Bitcoin’s price somewhere around the middle of July 2025.
Bitcoin Consolidates Upside Predicted
The 17th of December saw a new record high of $108,268. Still, Bitcoin has been unable to break out of its four-week price consolidation zone since its meteoric surge in 2024, according to data from Cointelegraph Markets Pro and TradingView. Bitcoin analyst and trader Dave the Wave claims that despite a 14% decline from these all-time highs, the price of Bitcoin (BTC$95,318) still has plenty of space to rise, as seen by the 52-week simple moving average (SMA).
Even though several studies and data sets have provided different forecasts in recent weeks, Bitcoin’s Price Correction has historically followed the levels indicated by the logarithmic growth curve (LGC), with the 52-week simple moving average (SMA) touching the middle band of the channel to indicate that BTC price has peaked. The price of bitcoin had its all-time high when the one-year moving average crossed the halfway point of the LGC channel,” Dave the Wave wrote on X on January 13.
Bitcoin 2025 Peak & SMA Signal
However, as can be seen from the chart above, the price has typically reached its highest point either a few days or months before or after the moving average passes the middle line of the LGC. Specifically, in 2013, Bitcoin’s 52-week simple moving average (SMA) flashed its top signal on December 13th, coinciding with the price peak.
While December 17 was Bitcoin’s high point in 2017, January 15 was the highest signal. Even before Bitcoin’s 2021 bull run peak of $69,000 on November 10th, the 52-week simple moving average (SMA) had shown the signal months earlier, on May 3rd.
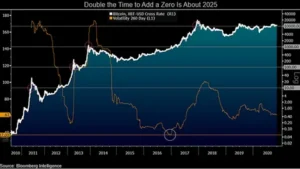
Hence, Bitcoin’s 2025 peak might collapse within a few days to months before or following the one-year SMA crossing the LGC’s middle line, which is anticipated to occur around mid-July. The less steep one-year moving average indicates “a maturing market,” according to Dave the Wave.
Bitcoin Correction Nearing Completion
According to crypto analyst Rekt Capital, the “first price discovery correction,” which happens between week six and week eight of the parabolic phase, is responsible for the ongoing consolidation in Bitcoin price. These alterations persist for a duration of two to four weeks. In a study of X published on January 11th, Rekt Capital noted that the present retracement has been ongoing for the past four weeks.
According to the time that has passed, this correction should thus be nearing completion. According to Axel Adler Jr., a fellow analyst, the present decline in Bitcoin value is not as severe as the previous consolidation phase, when the price of BTC fell by almost 26% from July 29th to August 5th, 2024.
Peter Brandt’s Bitcoin Price Predictions
At the same time, seasoned trader Peter Brandt posted a chart that might reveal three possible outcomes for Bitcoin’s Price Correction: a head-and-shoulders (H&S) pattern. According to Brandt’s first prediction, Bitcoin price might validate the pattern, finish the trend, and hit the H&S formation’s target below $77,000.
Two other possible outcomes are a bear trap or a morph into the larger pattern” when the price completes the pattern but does not reach the target. In addition, a fellow analyst, Bitcoin Munger, noticed large bids coming in on Binance between $85,000 and $92,000 and questioned if Bitcoin’s Price Correction would fall to meet them or climb to meet the $110,000 ask orders.
[sp_easyaccordion id=”3749″]