

Bitcoin market has finally delivered something traders have been craving for weeks: calm. On November 28, the Bitcoin daily chart showed a welcome change in tone. After days of heavy swings, sharp selloffs and nervous sentiment, BTC price action slowed down and began to stabilize. The candles shrank. The wicks softened. The chart started to look less like a battlefield and more like a market trying to find its balance.
As the trading week drew to a close, bulls managed to hold key support levels and keep Bitcoin trading inside a defined range instead of letting it slide into another panic-driven leg lower. For a market coming off a deep correction and intense volatility, that is not a small achievement.
This Bitcoin November 28 daily chart alert is important because stability often comes before direction. When bulls succeed in defending crucial zones into the weekend, it can set the tone for the next weekly open. The current picture suggests that buyers are still alive, still active and still willing to step in when prices approach important technical levels.
Bitcoin Daily Chart we will break down what the November 28 candle is telling us, how the daily chart structure is evolving, which levels the bulls are defending, what indicators are signaling under the surface, and what this could mean for Bitcoin in the days ahead.
The November 28 Daily Candle: What the Chart Really Shows
A Session Defined by Support Rather Than Fear
The first thing that stands out on the November 28 daily chart is the character of the candle itself. Instead of a long red bar slicing through support, the chart shows a relatively contained body with price closing comfortably within the recent trading range. That is a sign that sellers did not control the session from start to finish.
Intraday, Bitcoin did face downward pressure. Bears tested familiar zones, hoping to knock BTC out of its fragile balance. But each time price approached the lower boundary of the range, buyers appeared. The lower wick on the candle reveals that attempts to push the market down were rejected. That rejection is the footprint of demand. For traders who have watched Bitcoin bleed lower on earlier days, seeing bids appear at reasonable levels is a psychological boost. It suggests that the market is no longer in pure “sell first, think later” mode.
Closing Near the Middle of the Range
Another important detail is where the November 28 candle closed. Rather than collapsing at the low of the day, Bitcoin finished closer to the mid-point of recent price action. That kind of close has a calming effect on the chart. It implies balance, not domination by one side.
In the broader context of the week, this daily close helps bulls in two ways. First, it avoids triggering fresh waves of fear heading into the weekend. Second, it preserves the structure of the current consolidation pattern. As long as the range remains intact, the bulls can still build a case for a base forming near current levels.
Range-Bound Trading: How Bulls Stabilized Bitcoin to End the Week
Holding the Short-Term Support Zone Bitcoin
The most significant achievement for bulls on November 28 was defending short-term support. Over the previous sessions, a clear zone had emerged where Bitcoin repeatedly found buyers. Each test of that area mattered. The November 28 daily chart shows that this zone held once again. Each successful defense of support reinforces the idea that price is respecting a floor.
When traders see that floor hold several days in a row, confidence begins to return. This is how fear gradually turns into cautious optimism. The daily chart reflects that process. The more times bears fail to break the same level, the more energy they expend without reward. In contrast, bulls can feel that the market is starting to lean in their favor, even if the price has not yet launched into a new uptrend.
Sellers Lose the Initiative
Earlier in the month, sellers clearly had the upper hand. They could push BTC lower with relative ease. Breaks of intraday support levels were common. Each bounce seemed to be weaker than the one before it. Now the story is different. On November 28, sellers tried to repeat the same pattern, but the chart shows that their attempts lacked the same punch. Dips were met with buying.
The daily candle did not extend dramatically beyond previous lows. Instead, it fit neatly into the broader consolidation. When bears lose the ability to force the market into new extremes, the initiative begins to shift. That does not mean a full trend reversal is guaranteed. But it does mean that Bitcoin bulls are no longer just absorbing blows. They are starting to push back, if only by stopping further damage.
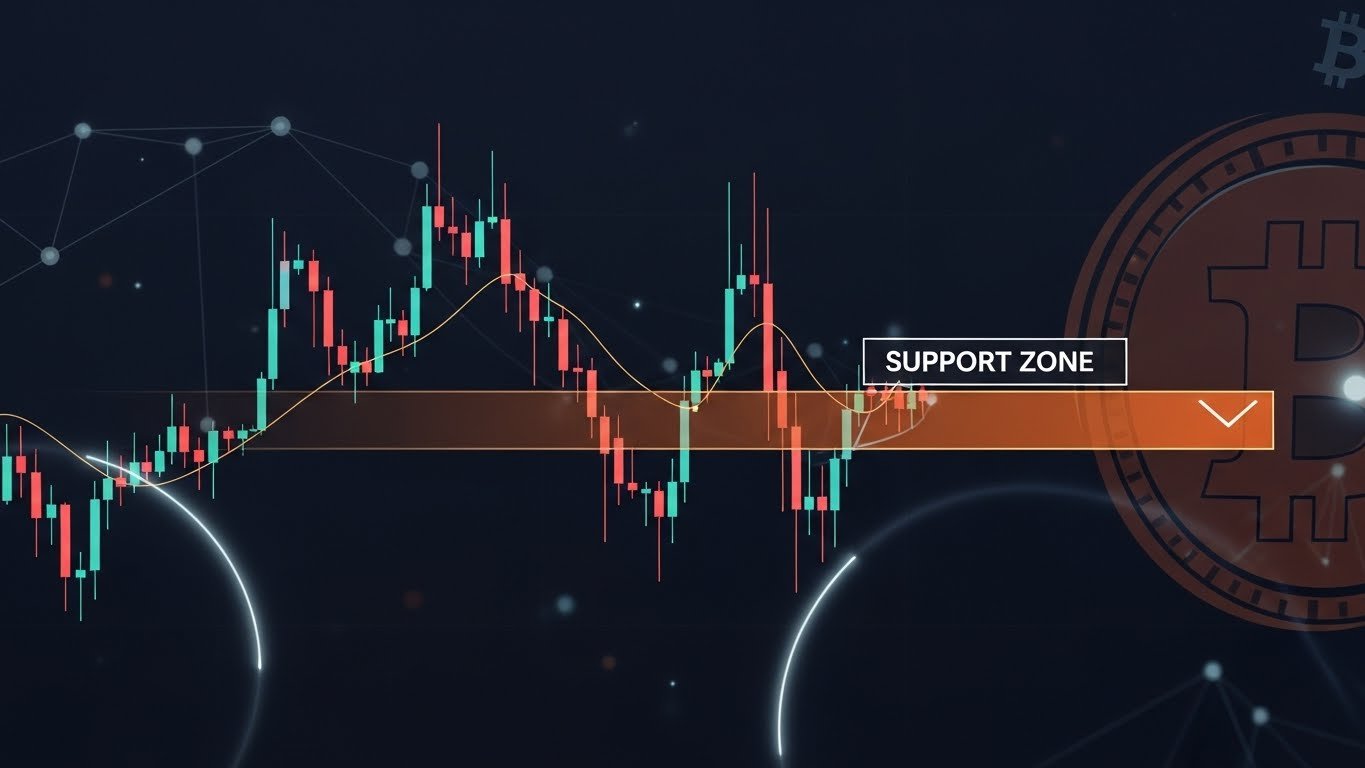
Key Levels on the Bitcoin November 28 Daily Chart
On the current daily chart, the lower boundary of the active range has become the line that bulls simply will not allow BTC to cross. Each time price approaches this area, the pattern repeats: short bursts of selling, followed by strong buying and recovery. This level serves as a reference for both short-term traders and swing participants. For bulls, it is the zone where adding or defending positions makes the most sense. For bears, it is the battleground they must win to regain control. The November 28 candle shows that, at least for now, bulls remain in charge of this crucial frontier. If Bitcoin can continue to protect this lower boundary into the start of the next week, the argument for a forming base becomes stronger.
The Upper Boundary The Ceiling That Still Holds
On the other side of the range, the daily chart reveals a clear ceiling. This upper boundary is where recent rallies have stalled. Sellers are active there, either taking profit from lower entries or opening fresh short positions. On November 28, Bitcoin did not break through this ceiling, but that is not a reason to dismiss the bulls’ progress. Stabilization often comes first, then expansion.
The immediate task for bulls has been to stop the bleeding and create a stable platform. Breaking the ceiling is the next challenge. In the coming days, traders will watch for attempts to test this upper boundary. The way Bitcoin behaves when it approaches that level will give clues about whether the market is ready to transition from consolidation to recovery.
Candlestick Context: How Recent Sessions Lead into November 28
From Big Candles to Smaller Bodies
One of the clearest changes visible on the Bitcoin daily chart is the shift in candle size. During the sharpest part of the correction, each daily candle covered a large range. Prices opened near the top of the day and closed near the bottom, or the other way around. Volatility was wide and relentless. As the week progressed toward November 28, the candles gradually became smaller. The price ranges compressed. Wicks appeared on both ends, showing that neither side could completely dominate the session.
This slow compression often signals that a market is moving from an impulsive phase into a balancing phase. The November 28 candle fits that pattern perfectly. It continues the story of a market that is no longer charging recklessly in one direction, but instead is testing and retesting a narrower band of prices.
The Role of the Weekly Close
Bitcoin Daily Chart November 28 falls near the end of the trading week, its daily close carries extra weight. Weekly candles summarize several days of emotion, positioning and news. A relatively calm final daily candle helps produce a weekly close that does not look disastrous. This matters for sentiment. A weekly chart that shows a long, ugly red candle into the close can discourage buyers and encourage bears to press their bets. A weekly chart that shows a more neutral close, supported by a steady final daily candle, helps keep the market open to both upside and downside possibilities. On November 28, bulls did exactly what they needed to do to keep that door open.
Indicators and Momentum: What the Tools Say Beneath Price
Momentum Cooling, Not Collapsing

Momentum indicators on the November 28 daily chart, such as RSI and MACD, reflect a market that has cooled significantly from its overheated peak. Earlier in the month, readings pointed to extreme conditions. Now they occupy more neutral territory. This cooling is healthy. It means the market has had time to digest the earlier move, clear out the most aggressive positions and reset the technical picture. A neutral momentum backdrop gives Bitcoin more freedom to move in either direction based on fresh flows and new information. On November 28, these indicators did not signal a powerful new uptrend, but they did suggest that bearish momentum is no longer overwhelming.
Volatility Compressing Into a Potential Coil
Volatility tools, including measures of daily range and average true range, show that Bitcoin’s day-to-day swings have narrowed. When volatility compresses after a strong directional move, it often marks the beginning of a “coil” phase where the market builds energy before its next breakout. The November 28 daily chart sits right in the middle of this process. It is part of a cluster of candles that together represent a potential coil. Traders know that coils tend to resolve sharply. The question is not if volatility will expand again, but when and in which direction. For now, the signs of stabilization and the successful defense of support give bulls a small, but real, advantage in that future contest.
Sentiment and Flow: How Traders Are Reacting to Stabilization
Fear Easing, But Not Gone
Sentiment around Bitcoin has improved compared to the peak of the correction, but it is not euphoric. Many traders are still wary. They remember how quickly the price fell and do not want to be caught off guard. This cautious mood can actually be a positive feature for bulls. Markets often build sustainable trends when participants are skeptical rather than blindly optimistic. The November 28 stabilization happened in an environment where fear has eased just enough to allow buying, but not enough to create dangerous complacency.
Spot and Derivatives in Better Balance
Flows in both spot markets and derivatives have shifted toward a healthier balance. Earlier, derivatives markets were dominated by over-leveraged longs. Now, open interest is more reasonable. Funding rates are closer to neutral. Spot demand has played a larger role in recent stabilization. The November 28 daily chart can be seen as the visual outcome of this better balance. Price is no longer being yanked around by liquidations and extreme positioning. Instead, it is being shaped by a more natural interaction between buyers and sellers.
What November 28 Means for the Next Trading Week
A Foundation, Not a Finale
The stabilization on November 28 should not be viewed as the end of the story. Instead, it marks the construction of a foundation. Bulls have proved that they can hold support and limit damage into a weekly close. That is step one. Step two will be testing higher levels. The next week will likely bring at least one attempt to move closer to the top of the range, and possibly an effort to break it. How Bitcoin behaves during those tests will determine whether this foundation becomes a true launchpad or simply a resting place before more indecision.
Scenarios: Gradual Grind, Breakout or False Start
From this point, several paths are possible. Bitcoin could continue to grind sideways, building an even thicker base before any explosive move. It could gather enough strength to break above the current ceiling and start a new leg higher. Or it could stage a brief rally that fails, sending price back to test support again. The key takeaway from the November 28 daily chart is that, whichever path the market chooses, bulls are no longer on the ropes. They have stabilized the fight. That alone changes the nature of the game.
Conclusion
The Bitcoin November 28 daily chart does not scream excitement at first glance. There are no giant green candles, no sudden surges, no dramatic reversals. Instead, it shows something quieter and, in many ways, more impressive: control. Bulls have managed to stabilize price into the end of the trading week. They have defended key support levels. They have cooled selling pressure. They have allowed momentum and volatility to reset from extremes. They have turned a market that was spiraling into one that is now pausing, thinking and preparing.
Bitcoin Daily Chart does not guarantee an immediate rally. It does not erase the risk of further tests or even a fresh leg lower if conditions change. But it does mean that Bitcoin is no longer in free fall. It is standing on a defined floor, inside a clear range, with bulls finally playing a meaningful role again. For traders and investors, the November 28 candle is a signal to pay attention. The next big move may not happen tomorrow, but the groundwork for it is being laid now, one quiet daily close at a time.
FAQs
Q: Why is the November 28 daily candle important for Bitcoin?
The November 28 daily candle is important because it shows Bitcoin stabilizing after a period of strong selling. Bulls defended key support levels and prevented another sharp leg down, which helps support the idea of a short-term base forming.
Q: Does stabilization mean Bitcoin will go up next week?
Not necessarily, but stabilization is a necessary first step before any sustained move higher. It means sellers are losing some control and the market is shifting from panic to balance. The next week will show whether that balance tilts toward a breakout or more sideways action.
Q: What levels should traders watch after the November 28 close?
Traders should watch the lower boundary of the current range as key support and the upper boundary as resistance. If support continues to hold and resistance is eventually broken with strong volume, it would confirm a more bullish shift.
Q: Are technical indicators bullish after November 28?
Most indicators are neutral rather than strongly bullish. Momentum has cooled from extreme levels and volatility has compressed, both of which are consistent with a market that is stabilizing and could be preparing for a larger move in either direction.
Q: How should long-term investors view this daily chart alert?
Long-term investors can view the November 28 chart as a sign that the worst phase of the recent correction may be easing. The defense of support and narrowing volatility suggest the market is trying to form a base. For long-term strategies, such periods often become attractive moments to reassess positions or gradually accumulate.