

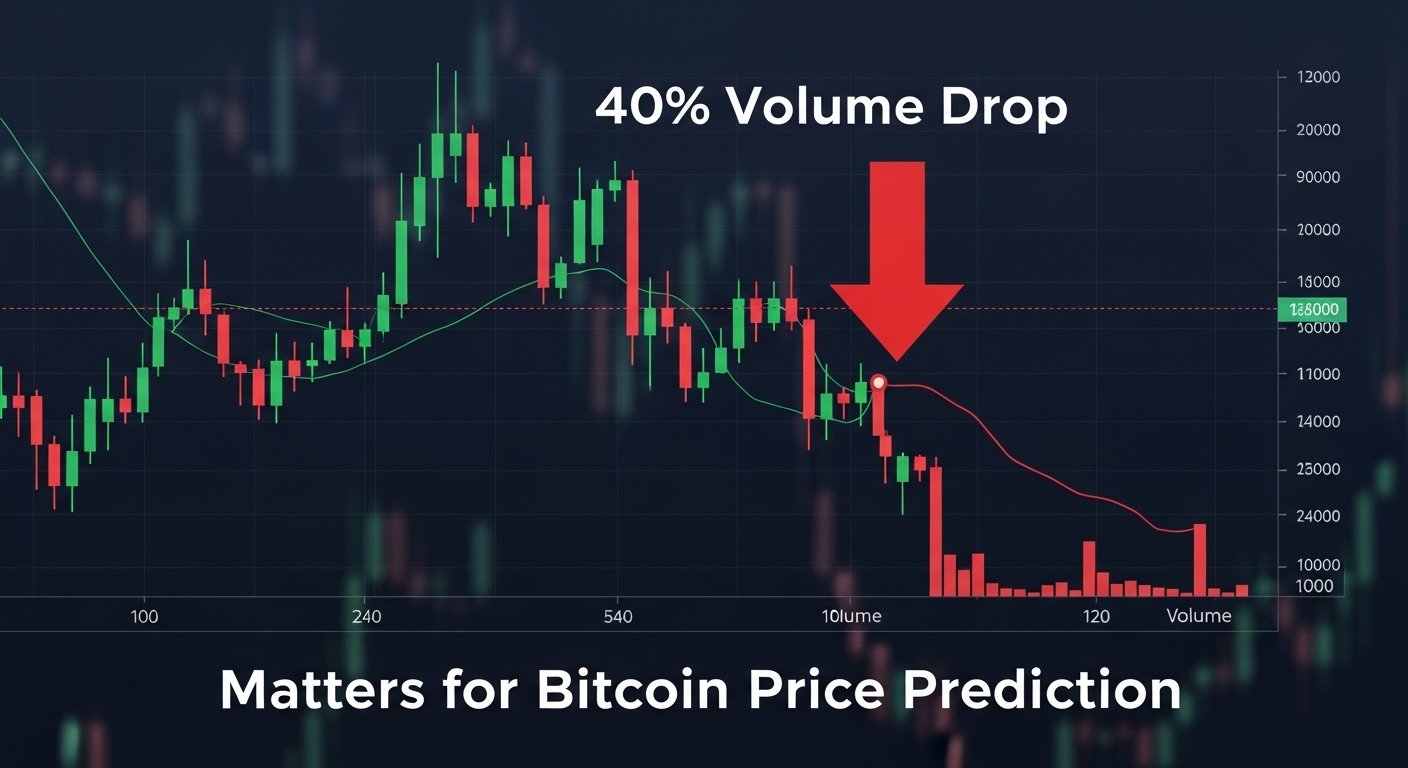
A sharp shift in trading activity can change the tone of the entire crypto market in hours. That’s why the latest setup has traders glued to their screens: BTC is testing the $83K zone while reported spot and derivatives activity around $50B has fallen roughly 40%. When volume contracts this hard during a major retest, it often signals a decision point—either the market is quietly absorbing supply before a rebound, or momentum is fading and support is about to give way. In either case, the next move tends to be fast, emotional, and highly tradable.
This is where a careful Bitcoin price prediction matters. Price alone doesn’t tell the full story; volume, liquidity, positioning, and macro sentiment determine whether $83K behaves like a launchpad or a trapdoor. A drop in volume doesn’t automatically mean “bearish,” but it can indicate weaker participation, thinner order books, and a higher risk of sudden wicks—especially if leveraged traders are crowded on one side. At the same time, declining volume at support can be a classic stabilization pattern, hinting that sellers are running out of ammunition.
In this article, we’ll build a practical Bitcoin price prediction around what a 40% volume decline can imply while BTC tests $83K. We’ll walk through the market structure, key technical levels, support and resistance zones, and the signals traders commonly monitor—from RSI and moving averages to funding rates, open interest, and on-chain data. We’ll also map several scenarios: breakdown, bounce, and consolidation, along with what could confirm each path. The goal is not hype, but clarity—so you can understand the risk and the opportunity when BTC is perched on a major line in the sand.
Why a 40% Volume Drop Matters for a Bitcoin Price Prediction
A strong Bitcoin price prediction starts with understanding why volume is falling in the first place. Markets move on participation. When volume declines sharply, it can mean fewer buyers and sellers are willing to transact at current prices. That reduced activity often creates “air pockets” where price can slide quickly if a support level fails, because there simply aren’t enough bids stacked beneath the market.
At the same time, volume contraction can also suggest that the market is waiting. Traders may be hesitant ahead of macro catalysts, regulatory headlines, major economic prints, or large options expiries. In those periods, BTC can chop sideways in a tight range, and then explode once uncertainty clears. So the volume drop itself isn’t a verdict—it’s a warning that the next significant move may come with heightened volatility and less liquidity.
For this Bitcoin price prediction, the key question is whether the volume decline is happening because demand is exhausted, or because supply is exhausted. If sellers have already done most of their selling and buyers are patiently accumulating near support, volume can fade as the market stabilizes. If buyers are stepping away because confidence is weakening, volume can fade as price drifts lower and stops get triggered. The difference becomes visible in how BTC behaves at $83K: does it hold with repeated defenses, or does it slip with minimal resistance?
The $83K Level: Psychological and Structural Significance
Every credible Bitcoin price prediction needs a map of the battlefield, and $83K is clearly one of the main front lines right now. Round-number zones matter because traders place orders there, set alerts there, and anchor narratives there. But beyond psychology, levels matter when they align with market structure—prior swing highs/lows, consolidation shelves, and areas where a lot of volume previously traded.
If BTC is “testing” $83K, it implies the market is repeatedly probing that area. Multiple tests can strengthen support if buyers keep defending it, but repeated tests can also weaken support by consuming bids. That’s why a Bitcoin price prediction around $83K must focus on the quality of the bounce. A sharp bounce on improving volume suggests demand. A weak bounce on declining volume suggests the market is just pausing before another push down.
Another layer is liquidity. Many traders set stop-losses just below obvious support. If $83K breaks cleanly, price can accelerate as stops turn into market sells. In thin volume conditions, that acceleration can be dramatic. So $83K isn’t just a number; it’s a potential liquidity trigger that can define the next leg of trend.
Market Structure Check: Is BTC Still Bullish Above $83K?
Before making any short-term Bitcoin price prediction, zooming out is essential. BTC can be in a broader uptrend while still being vulnerable to a sharp local breakdown. Market structure is about higher highs and higher lows on a chosen timeframe. If BTC has been printing higher lows and holding key moving averages, the trend can remain constructive even if price briefly dips below a local support.
However, if $83K aligns with a prior higher low on a daily chart, a breakdown could shift structure from bullish to neutral or bearish. That’s where traders begin looking for a lower high, followed by another lower low—classic reversal behavior. In that case, the Bitcoin price prediction tilts toward a deeper retracement to the next demand zone rather than an immediate recovery.
Structure also interacts with sentiment. When BTC is near all-time highs or major breakout zones, traders are often quick to buy dips. When BTC starts losing key levels, dip-buying can slow, and rallies can turn into sell-the-rip opportunities. The market’s reaction at $83K helps reveal which regime we’re in.
Technical Indicators to Watch in This Bitcoin Price Prediction
A volume-driven Bitcoin price prediction becomes sharper when paired with a few reliable indicators. None of these should be treated as magic, but together they can improve your read on momentum and risk.
RSI and Momentum Divergences
RSI helps gauge whether BTC is gaining or losing momentum. If BTC is testing $83K while RSI is stabilizing or rising, it can indicate that selling pressure is fading even if price looks heavy. If BTC is grinding lower and RSI is also trending lower, momentum is aligned with bearish continuation, raising the odds of a breakdown.
Divergences matter here. If price makes a similar low near $83K but RSI prints a higher low, some traders interpret that as a weakening downtrend. In a Bitcoin price prediction, that kind of divergence can support a bounce scenario—especially if it’s confirmed by improved volume on the rebound.
Moving Averages and Dynamic Support
Moving averages often act like dynamic support and resistance. If BTC is holding a key average (commonly tracked ones include the 50-day or 200-day on higher timeframes), buyers may view dips as opportunities. If BTC is below a key average and failing to reclaim it, rallies can be sold aggressively.
In thin volume environments, BTC can wick above or below moving averages and snap back quickly. That’s why confirmation matters: does BTC close above a key average with follow-through, or does it get rejected? For a practical Bitcoin price prediction, closing behavior is often more meaningful than intraday spikes.
Volume Profile and Liquidity Zones
A strong Bitcoin price prediction respects where real trading happened. Volume profile concepts focus on high-volume nodes (areas of heavy trading) and low-volume gaps (areas where price moved quickly). If $83K sits near a low-volume pocket underneath, a breakdown can lead to fast downside travel until BTC hits the next high-volume node where bids cluster.
This is also where order book depth matters. With volume down 40%, order books can thin out. Thin books can amplify moves, making support breaks more violent and recoveries more explosive. Watching how liquidity rebuilds around $83K can hint whether the market is preparing for defense or capitulation.
Derivatives Data: Funding Rates, Open Interest, and Liquidation Risk
Any modern Bitcoin price prediction should include derivatives because BTC’s short-term volatility is often driven by leverage. When traders pile into long positions, a small dip can cascade into liquidations. When traders pile into shorts, a small pump can trigger a squeeze.
Open Interest as a Pressure Gauge
Open interest rising while price falls can signal that traders are adding shorts or that longs are trapped. Either way, it can increase the chance of a sharp move—because crowded positioning tends to unwind violently. If open interest is falling with price, it can indicate de-risking and position closures, which sometimes precedes stabilization.
For this Bitcoin price prediction, a critical clue is whether open interest expands near $83K. If it does, expect volatility. If it contracts, the market may be resetting for a more organic move.
Funding Rates and Trader Crowding
Funding rates reflect whether longs or shorts are paying. If funding is persistently positive while BTC is slipping toward $83K, it can suggest longs are still crowded, making a breakdown more dangerous because liquidations can accelerate the move. If funding flips negative near support, it can hint the market has become defensive, sometimes setting up a rebound or short squeeze.
Funding doesn’t “predict” direction, but it helps shape a Bitcoin price prediction by identifying when one side of the trade may be overconfident.
Liquidation Clusters Around Obvious Levels
The closer BTC gets to a widely watched level like $83K, the more likely liquidation clusters sit just beyond it. If BTC slices through $83K with speed, liquidations can create a waterfall effect. If BTC dips below briefly and then reclaims, it can be a classic liquidity sweep that traps late shorts and shakes out weak longs—often followed by a strong bounce.
In low volume conditions, these stop-runs become more common. That’s why a responsible Bitcoin price prediction treats $83K as a zone, not a precise line.
On-Chain Signals That Can Support or Contradict This Bitcoin Price Prediction
While technicals reflect price behavior, on-chain data can hint at what different groups are doing. Not every trader uses on-chain metrics, but they can add context—especially when volume is shifting.
If long-term holders are accumulating and exchange balances are declining, it can support a bullish Bitcoin price prediction even if short-term price looks weak. If exchange inflows spike and dormant coins begin moving, it can increase the risk of distribution, supporting a bearish scenario. Similarly, whale activity—large transfers to exchanges—can sometimes precede volatility, although it’s not always bearish (some transfers are internal or custodial).
Miner behavior can matter too. If miner selling increases during a fragile support test, it can add pressure. If miner outflows are muted, it reduces one source of supply. These signals don’t replace chart levels, but they can help interpret why BTC is reacting the way it is at $83K.
Scenario 1: Breakdown Below $83K—What It Would Likely Look Like
The bearish version of this Bitcoin price prediction becomes more likely if BTC fails to defend $83K on repeated tests and bounces become weaker. The most common breakdown pattern is a clean loss of support followed by a failed reclaim. In other words, BTC drops under $83K, tries to rally back above it, and gets rejected. That rejection often confirms that prior support has turned into resistance.
In a low volume environment, the initial breakdown can be swift. If stop-losses and liquidations hit at the same time, BTC can drop to the next demand zone faster than many expect. A breakdown is also more credible if it happens with expanding sell volume or if the broader market (risk assets) is turning risk-off.
What comes next depends on where the next meaningful bid wall sits. In many BTC structures, the next major support tends to be the prior consolidation shelf below current price. If the market recently ranged before pushing higher, that range can become the next target during a correction. A grounded Bitcoin price prediction doesn’t pretend to know the exact bottom; it identifies where probability improves and where sellers may begin taking profits.
Scenario 2: Bounce From $83K—How Bulls Can Regain Control
The bullish Bitcoin price prediction centers on $83K holding as a defended floor. A high-quality bounce typically shows a few traits: BTC holds the level on multiple dips, prints higher intraday lows, and then reclaims a nearby resistance zone with improving volume. The key is participation. If volume is down 40% and then starts rising as BTC rebounds, it suggests new demand is stepping in.
A bullish recovery also looks stronger if BTC can reclaim a key moving average and hold it as support. That shift often changes trader behavior from fear to opportunistic dip-buying. In that environment, short sellers can get trapped, and a squeeze can fuel upside continuation.
Another bullish tell is how BTC reacts after a brief breakdown. If price dips below $83K, triggers stops, and then quickly closes back above the level, it can be a liquidity sweep rather than a true breakdown. That’s why this Bitcoin price prediction emphasizes closes and follow-through. Bulls don’t need perfection; they need proof that demand exists and that sellers can’t press the advantage.
Scenario 3: Sideways Consolidation—The Market’s “Wait and See” Outcome
Sometimes the most accurate Bitcoin price prediction is simply that the market is undecided. A 40% drop in volume often accompanies consolidation. BTC can hover around $83K, repeatedly bouncing and dipping without strong continuation. That can frustrate both bulls and bears, but it also builds energy for a later expansion.
Consolidation near support can be constructive if it forms a base and gradually tightens. The longer BTC holds $83K without breaking, the more it suggests sellers are struggling to push through. But consolidation can also be a distribution pattern if rallies get sold quickly and BTC keeps tapping support. In that case, the range becomes a staging ground for a later breakdown.
A practical Bitcoin price prediction treats consolidation as a signal to focus on boundaries. When BTC is range-bound, the edges matter more than the middle. Breakouts and breakdowns from a tight range often produce the cleanest directional moves.
Macro and Narrative Catalysts That Can Flip the Bitcoin Price Prediction
Crypto doesn’t trade in a vacuum. A credible Bitcoin price prediction considers macro liquidity, rates, and risk sentiment. If broader markets turn defensive due to economic shocks, tighter financial conditions, or sudden geopolitical fear, BTC can lose support even if crypto-native indicators look okay. Conversely, improving liquidity conditions and renewed risk-on sentiment can help BTC bounce even when volume looks weak.
Crypto-native narratives also matter. Spot Bitcoin ETF flows, regulatory headlines, exchange stability news, and large corporate treasury moves can all change demand quickly. In thin volume conditions, even a moderate catalyst can cause an oversized price reaction because liquidity is limited.
This is why traders often watch the calendar. If big macro events or options expiries are near, volume can dry up ahead of them, and then surge afterward. The best Bitcoin price prediction stays flexible: it defines what must happen for each scenario and responds to confirmation rather than forcing a single storyline.
Key Confirmation Signals to Watch Next
For this Bitcoin price prediction to become actionable, focus on confirmation. If BTC holds $83K and starts printing higher lows, that’s a constructive shift. If BTC breaks $83K and fails to reclaim it, risk increases. If volume remains depressed and candles become erratic, expect wicks and stop-runs.
Also pay attention to how BTC behaves around nearby resistance. A bounce that can’t reclaim even a minor resistance zone often signals weakness. A bounce that recovers multiple levels with rising volume signals strength. If derivatives positioning becomes crowded, expect volatility spikes. If positioning resets and spot demand returns, the market can move more smoothly.
A realistic Bitcoin price prediction is less about one perfect call and more about reading the market’s “vote” in real time. Price action around $83K will deliver that vote.
Conclusion
This Bitcoin price prediction comes down to a simple but powerful dynamic: BTC is testing $83K while volume has dropped about 40%, and that combination often precedes a decisive move. Low volume can mean stabilization, but it can also mean fragility. If $83K holds and BTC reclaims nearby resistance with improving participation, the odds tilt toward a rebound and renewed bullish momentum. If $83K breaks and BTC fails to reclaim it, thin liquidity and leveraged positioning can accelerate a breakdown toward the next major demand zone.
In conditions like these, the best approach is to stay scenario-driven. Let BTC confirm direction through closes, volume expansion, and positioning shifts. Whether you lean bullish or bearish, a disciplined plan matters more than prediction pride. The market will show its hand—especially at a level as pivotal as $83K.
FAQs
Q: What does a 40% volume drop mean for a Bitcoin price prediction?
A 40% decline in volume often signals reduced participation and thinner liquidity, which can make BTC more vulnerable to sudden moves. For a Bitcoin price prediction, it means support and resistance levels can break more sharply, and false moves can be more common until volume returns.
Q: Is $83K the most important support level right now?
In this setup, $83K is a key zone because it’s being actively tested and likely contains heavy trader attention and stop placement. A Bitcoin price prediction that ignores the market’s reaction here is missing the main decision point, but it’s still wise to treat $83K as a zone rather than a single exact number.
Q: Can BTC bounce even if volume stays low?
Yes, a bounce can happen on low volume, especially if sellers are exhausted. However, a stronger Bitcoin price prediction for sustained upside usually requires volume to improve during the rebound, showing that fresh demand is entering rather than price simply drifting.
Q: How do funding rates affect the risk of a breakdown?
If funding rates stay strongly positive while BTC is weak, it can indicate crowded longs, increasing liquidation risk if support breaks. If funding turns negative near support, it can reduce downside pressure and sometimes supports a bullish Bitcoin price prediction through short squeeze potential.
Q: What’s the biggest mistake traders make during a support test like this?
The biggest mistake is treating the first move as “the” move. Around pivotal levels like $83K, BTC often produces fakeouts and liquidity sweeps. A better Bitcoin price prediction approach is to wait for confirmation through closes, follow-through, and volume behavior instead of reacting emotionally to every wick.
See More: Bitcoin (BTC) Price Over $150,000 When Will It Happen?